|
|
|
What is OncomiR
|
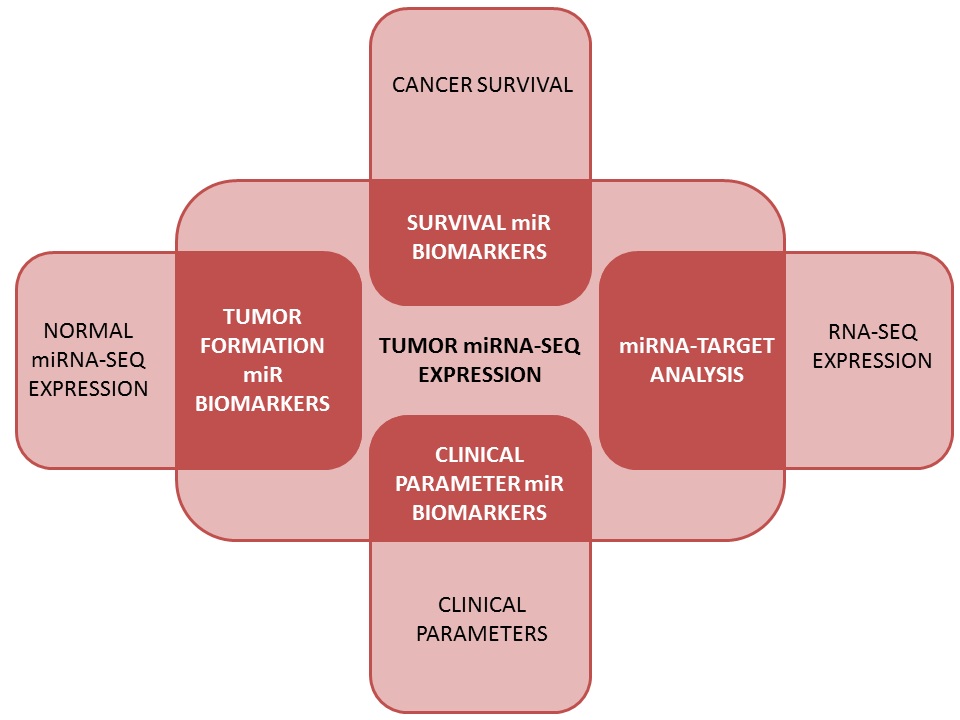
OncomiRs are microRNAs (miRNAs or miRs) with implications in cancer development, progression, and survival. OncomiR is an online
resource that explores the miRNomes of 30 cancer types and provides tools for researchers to identify and validate oncomiRs without the
need for immediate computational expertise.
The data for OncomiR were obtained from The Cancer Genome Atlas. From this resource, we were able to obtain processed miRNA-Seq,
RNA-Seq, and clinical data for almost 10,000 patients across 30 cancer types. Statistical analyses were then conducted to identify miRNAs
significantly associated with development, staging, and overall survival. The data itself is acccessible for survival anlysis and
patient clustering analysis.
The two major functions of OncomiR can be summarized as:
1. The identification of cancer-relevant miRNAs
2. De novo analysis based on miRNA expression
|
|
|
|
Tumor Development-Related miRNAs
|
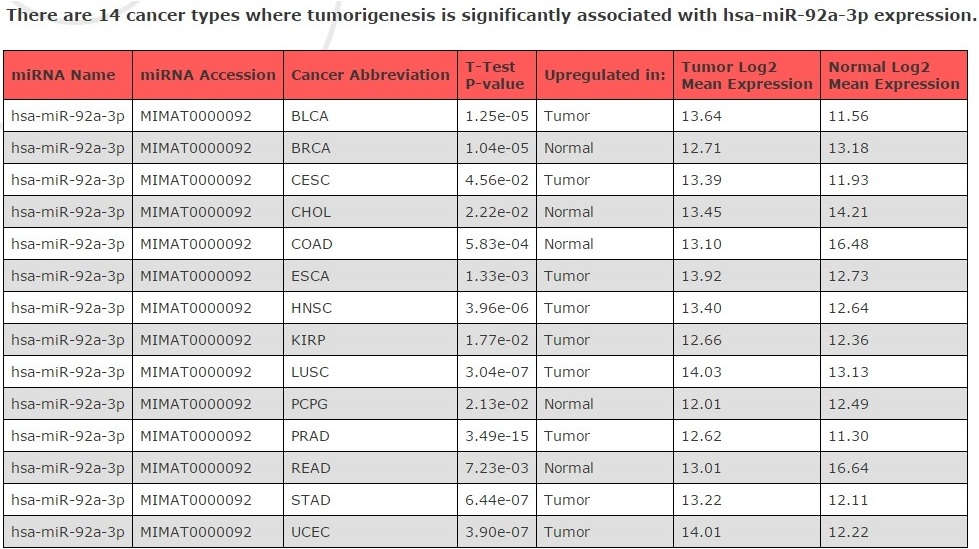
For tumor development, users can search either by a full miRNA name or accession (a) or by a
cancer type (b). Results were generated by comparing the miRNomes of patients who had paired
miRNA-seq profiles obtained from tumor and normal tissue samples. Under both search parameters, a significance threshold can be used as an
initial filter to limit the number of results returned.
|
| a) | 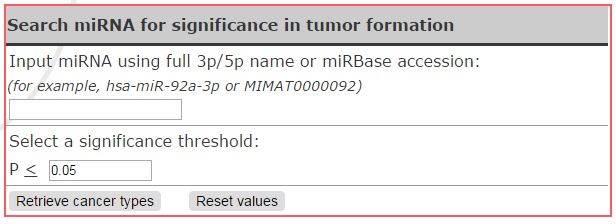 |
|
b) | 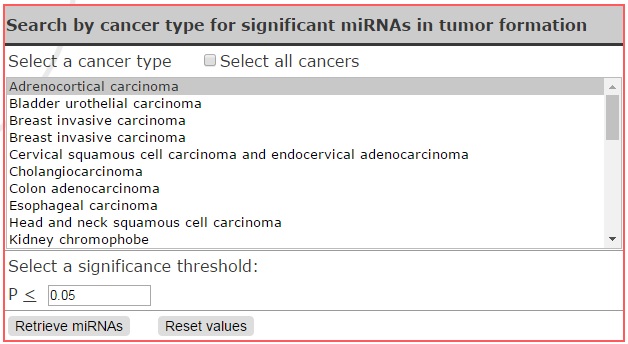 |
|
|
The table of returned values is organized to highlight the relationship between the miRNAs and the cancer types. Each row is identified by the pairing, and
includes the p-value of the paired t-test comparing miRNA expression between tumor and non-tumor tissues. The results also show the log2 transform of the mean
miRNA expression in both tumor and non-tumor tissues, and an indicator as to which tissue type exhibits higher expression.
|
|
Return to top
|
Tumor Staging and Grade
|
Researchers have indicated interest in comparing biomarkers to standard clinical parameters, such as tumor staging, nodal status, and tumor grade. To address
this, the miRNA expression was analyzed in relation to clinical stage and grade data within cancer types. For each clinical parameter, analysis of variance
(ANOVA) was conducted to determine if miRNA expression varied significantly among the degrees of the parameter (e.g. T1, T2, T3, and T4). As before, the
primary search parameter can be the miRNA name, in combination with one or more cancer types (a), or
the cancer type in addition to one or more clinical parameters (b).
|
| a) | 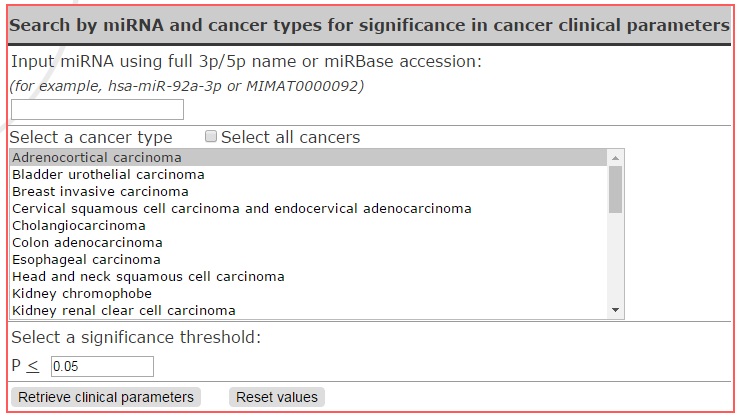 |
|
b) | 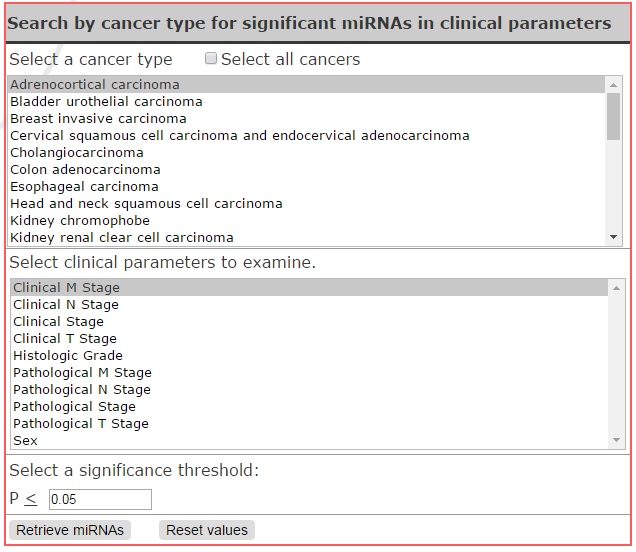 |
|
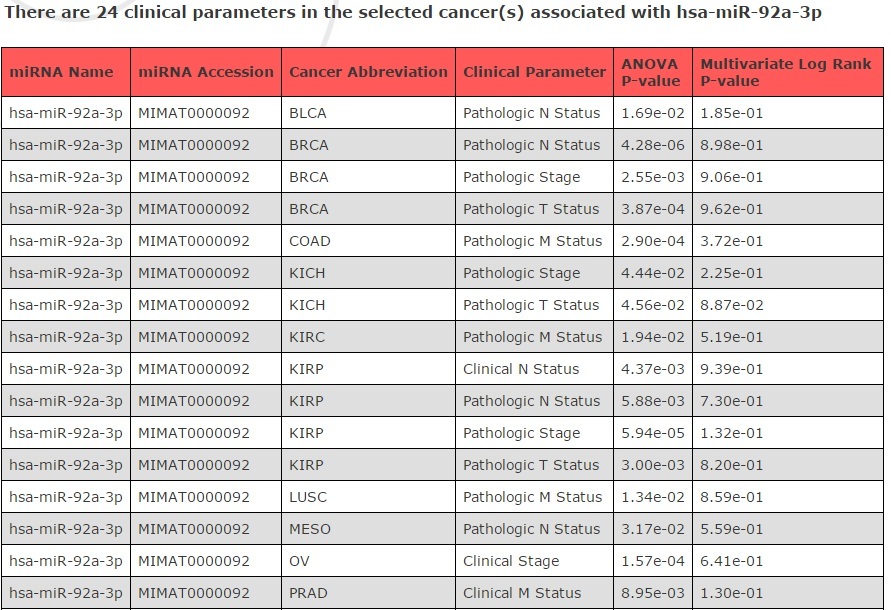
The results are in tabular format where each row indicates the relationship between a miRNA and a clinical parameter for a specific cancer type. The ANOVA
p-value is an indicator that the expression level of the miRNA is significantly different for at least one degree of the parameter in comparison to the remainder.
The multivariate log rank p-value is the result of the multivariate Cox proportional hazards analysis, which evaluates the combined effects of the miRNA
and the clinical parameter in overall survival duration. A low p-value indicates that the effect of miRNA expression on survival time is independent of the
given parameter.
|
|
Return to top
|
Tumor Survival
|
Evaluation of patient outcome is one of the primary goals of biomarker research. A biomarker that can indicate the likelihood of a patient to die as a result of
disease can provide clinicians with another tool in designing effective treatment plans. Univariate Cox proportional hazards analysis was conducted on each miRNA
within the cancer types to determine its relevance in patient survival time. Users can search by miRNA name
(a) to return a list of cancer types, or search by a cancer type (b) to retrieve a list of potential miRNA
survival biomarkers.
|
| a) | 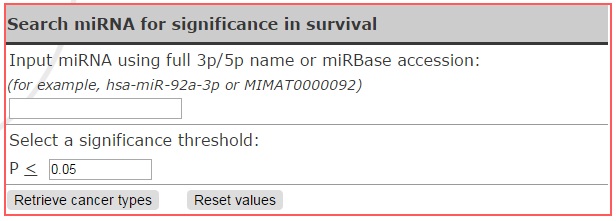 |
|
b) | 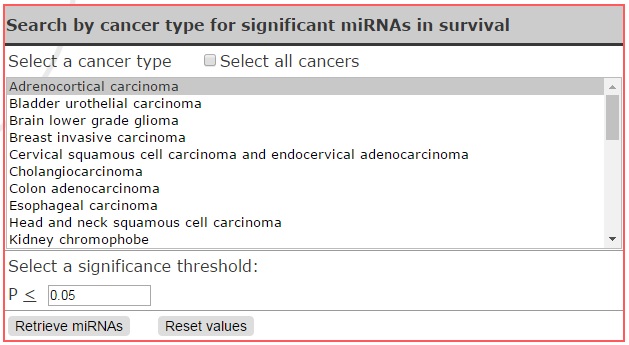 |
|
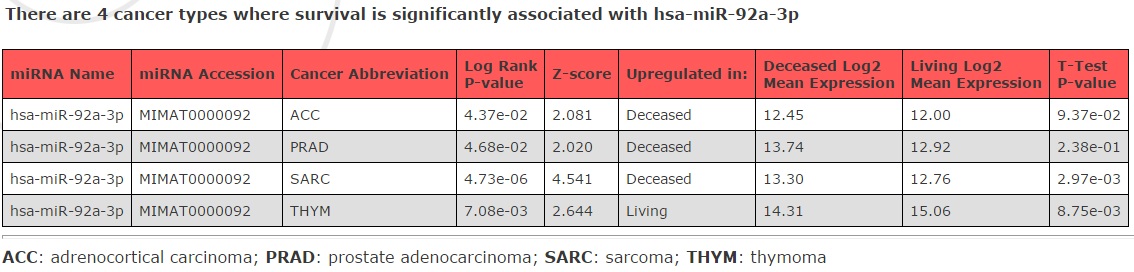
The table of results highlights the miRNA and the cancer type as the primary factors. The log rank p-value and Z-scores are two indicators of the relative
importance of the miRNA expression level with regards to survival time, and are obtained from the univariate Cox PH analysis. The expression levels of the miRNA
in both the living and deceased cohorts for the cancer type are also provided, as well as p-value from the unpaired Student's t-test.
|
|
Return to top
|
miRNA Expression Profiles
|
Users can submit a miRNA name and view its average expression profile across one or more cancer types,
(a) or view multiple miRNAs across a defined set of cancer types (b).
|
| a) | 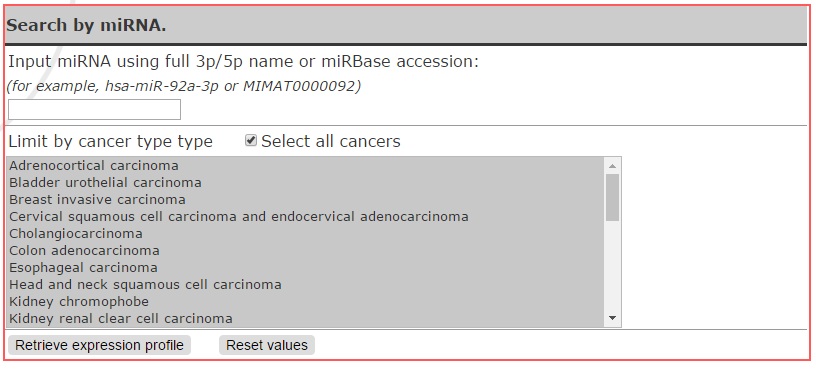 |
|
b) | 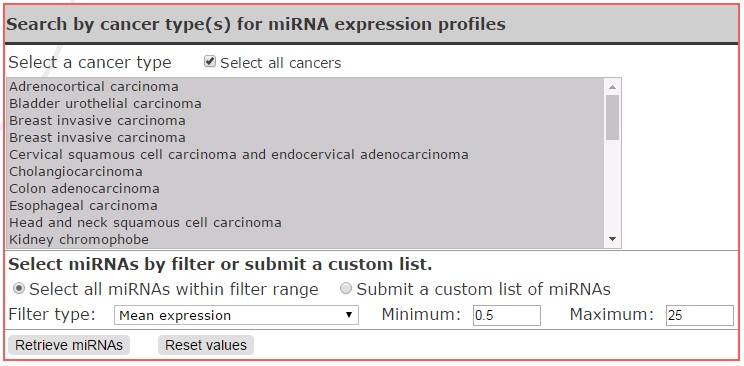 |
|
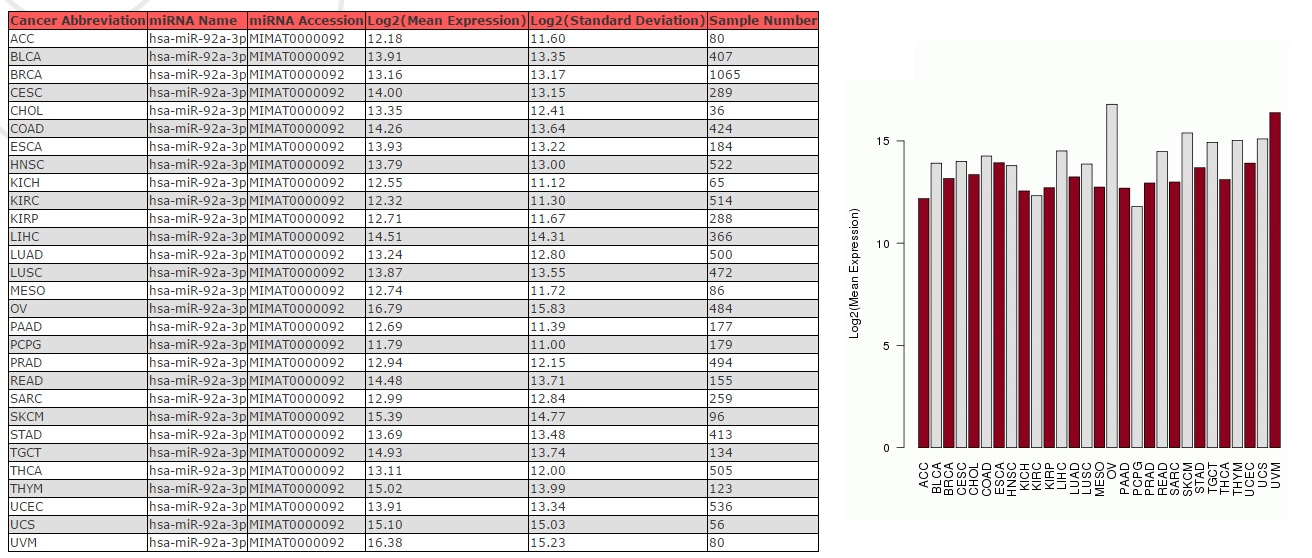
The results for a single miRNA are returned in both tabular and graphic form. The table includes the log2 transform of the mean miRNA expression
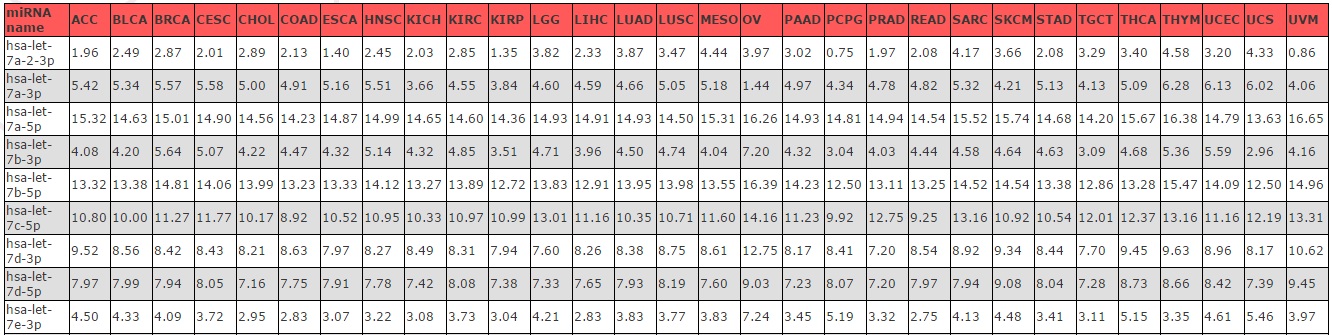
in a given cancer type, as well as the number of patient samples in the cohort, as well as a bar graph (a). Results for a multiple miRNA search
are presented as a table, with the miRNAs in the rows and the cancer types in the columns (b).
|
| a) |
|
| b) |
|
Return to top
|
Target Prediction
|
A major focus of miRNA research is the identification of valid mRNA targets. To address this, we have conducted Pearson correlation analysis to
analyze the relationships between pairs of miRNAs and target mRNA sequences as well as provided the scores from our previous computationally predicted results
(available at www.mirdb.org).
Users can search by miRNA to find predicted gene targets (a), or by selecting
a gene through name or NCBI accession to retrieve potential targeting miRNAs (b). Limits
can be imposed on the correlation p-value and the OncomiR score to restrict the results retrieved. Selecting all cancers will bring up
correlation results from all paired tumor and normal tissue samples; results may also be retrieved for one or more individual cancer types.
|
| a) | 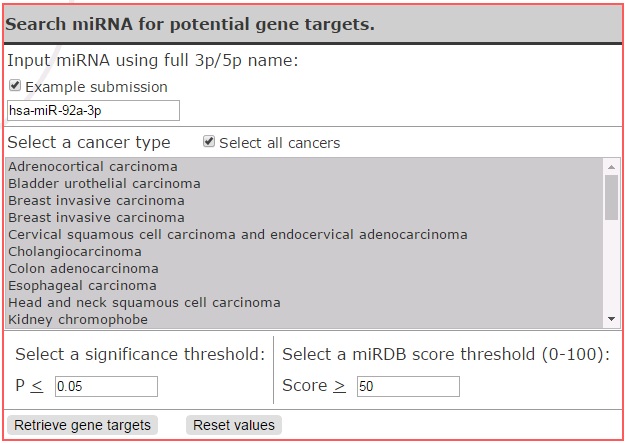 |
|
b) | 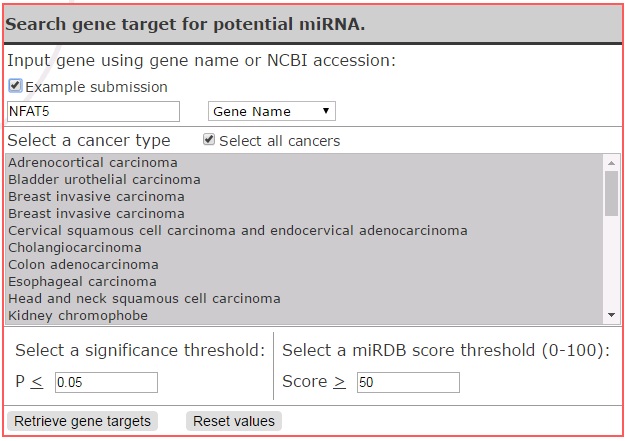 |
|
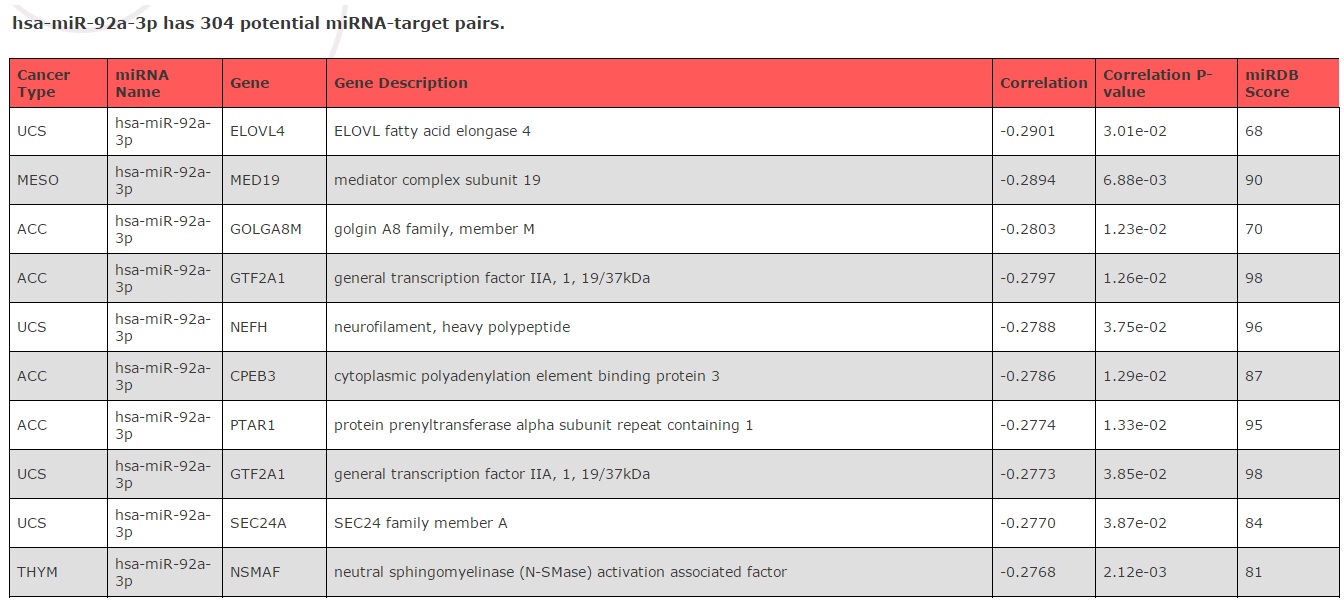
Results are presented as a table where the rows show the miRNA, the target gene and its description and NCBI accession, the correlation coefficient, and the miRDB score.
Correlation coefficients range from -1 to 1; more negative correlation values indicate that the predicted response is observed in the tissue samples, as high miRNA expression
should result in lower levels in the expression of the target mRNA. The miRDB scores range from 0 to 100, with scores above 50 being rated as higher confidence.
|
|
Return to top
|
Survival Signature Analysis
|
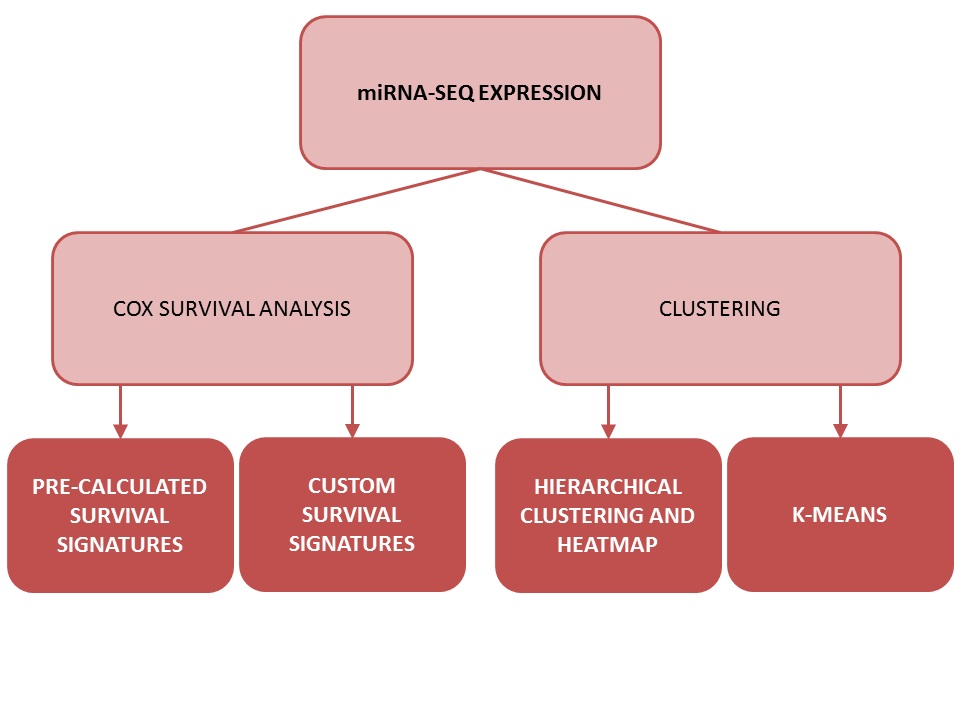
One of OncomiR's most distinctive features is the option to craft and evaluate miRNA-based survival signatures on the fly.
Users can analyze either pre-calculated miRNA signatures or submit their own custom miRNA
expression-based signatures.
Pre-calculated signatures were generated for each individual cancer type by selecting miRNAs through a combination of
univariate Cox PH analysis, expression level filters, and recursive feature elimination. The coefficients for the survival
miRNas in the signature were generated from the univarate Cox PH Z-scores (as described under the section "Tumor Survival").
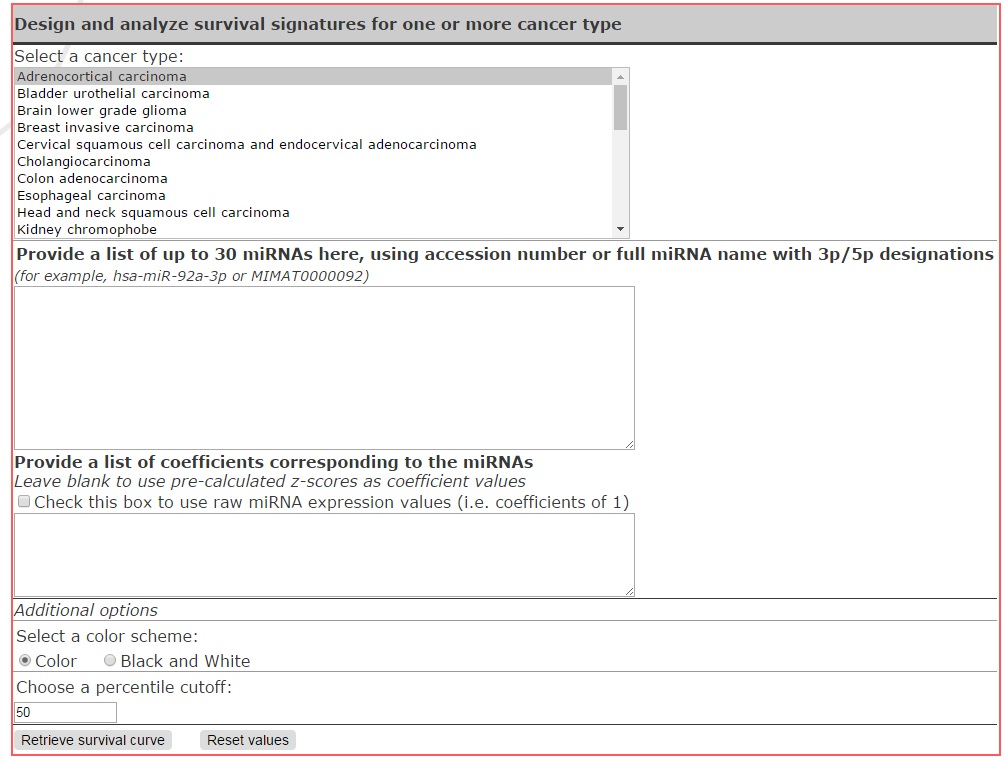
To create custom miRNA signatures, users can submit a list of up to 30 miRNAs by either full 3p/5p names or miRBase accessions. Coefficients are selected using one
of the following 3 options:
1. Providing a list of coefficients.
2. Leaving the box blank to use Z-scores from univariate Cox proportional hazards analysis (see miRNAs affecting survival).
3. Checking the option to use raw miRNA expression values (i.e. coefficients of 1)
With custom signatures, users are also given the option to pool more than one cancer type, if they wish to observe the effects of the miRNA signature across multiple cancer types.
Additional options include producing the survival curve in color or black and white, and selecting the percentile cutoff for high-/low-risk cohorts. The patients with risk scores
greater than the percentile cutoff will be classified as high-risk.
|
|
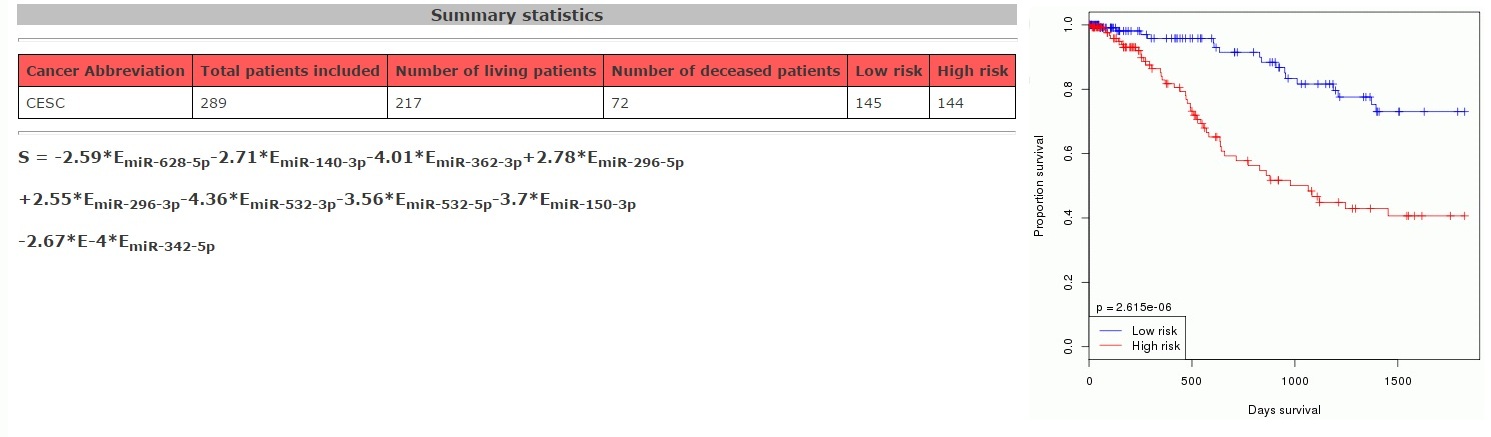
For both sets of analyses, the results are returned in the form of a survival curve, along with a table that details the number of patients in each cohort, the log rank p-value of the signature in
separating the cohorts, and the total number of deceased patients in the cancer set.
|
|
Return to top
|
| miRNA-Based Clustering of Cancer Types |
OncomiR offers two methods of clustering patients: k-means clustering and
hierarchical clustering.
K-means clustering requires that the user select a number of clusters into which to group cancer types. The algorithm begins with k number of centroids, and assigns patients to each centroid
based on distance, then recalculates the location of the centroid. This process is repeated until the centroids and the clusters are stable. To perform this clustering, users can select
one or more cancer types, then select either a list of submitted miRNAs or use filters (based on expression or standard deviation) to select miRNAs from the full list (a).
The results of k-means clustering are returned as a list of cancer types in each cluster (b).
|
| a) | 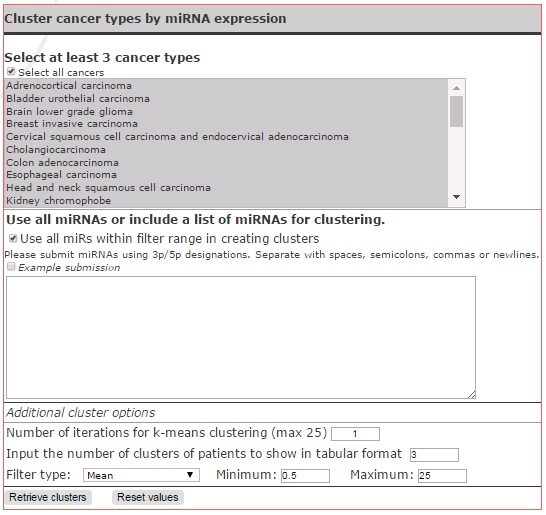 | b) | 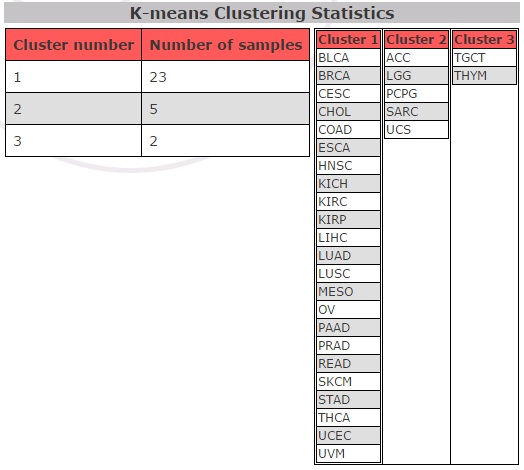 |
|
Agglomerative hierarchical clustering starts with each sample as its own individual cluster, and begins to merge clusters together based on similarity, thereby creating a dendrogram. Similarly
to k-means clustering, miRNAs to use in the cluster analysis are selected either through a list submitted by the user or selected through filtering. Options are also available regarding the color
scheme of the resulting heat map, as well as the number of subsets of the dendrogram to return as individual clusters (a).
Results are shown as a heat map, with the miRNAs on the x-axis and the cancer types on the y-axis. The summary tables are similar in design to those as produced in k-means clustering (b).
|
| a) | 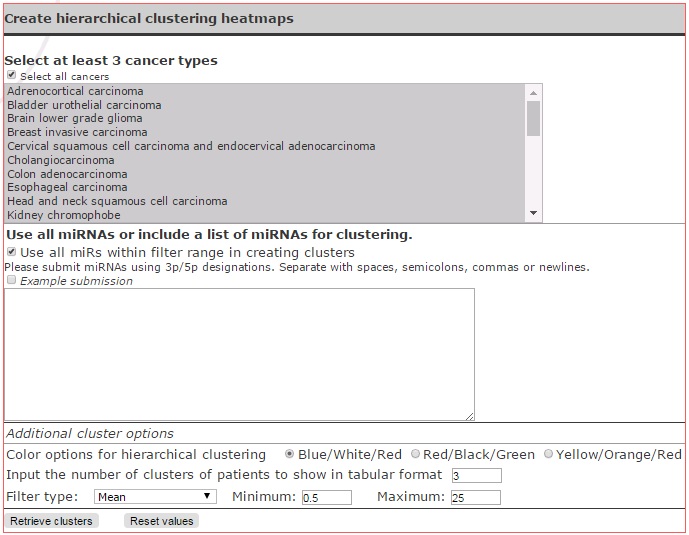 | b) | 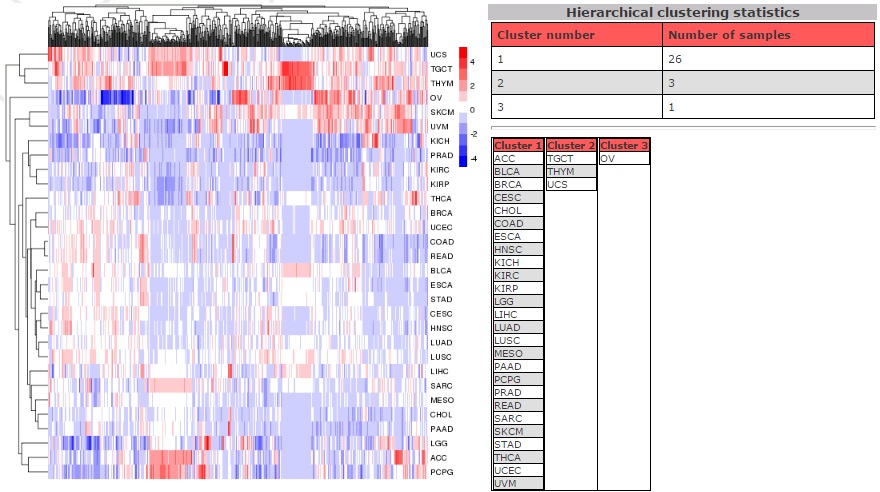 |
|
Return to top
|
|